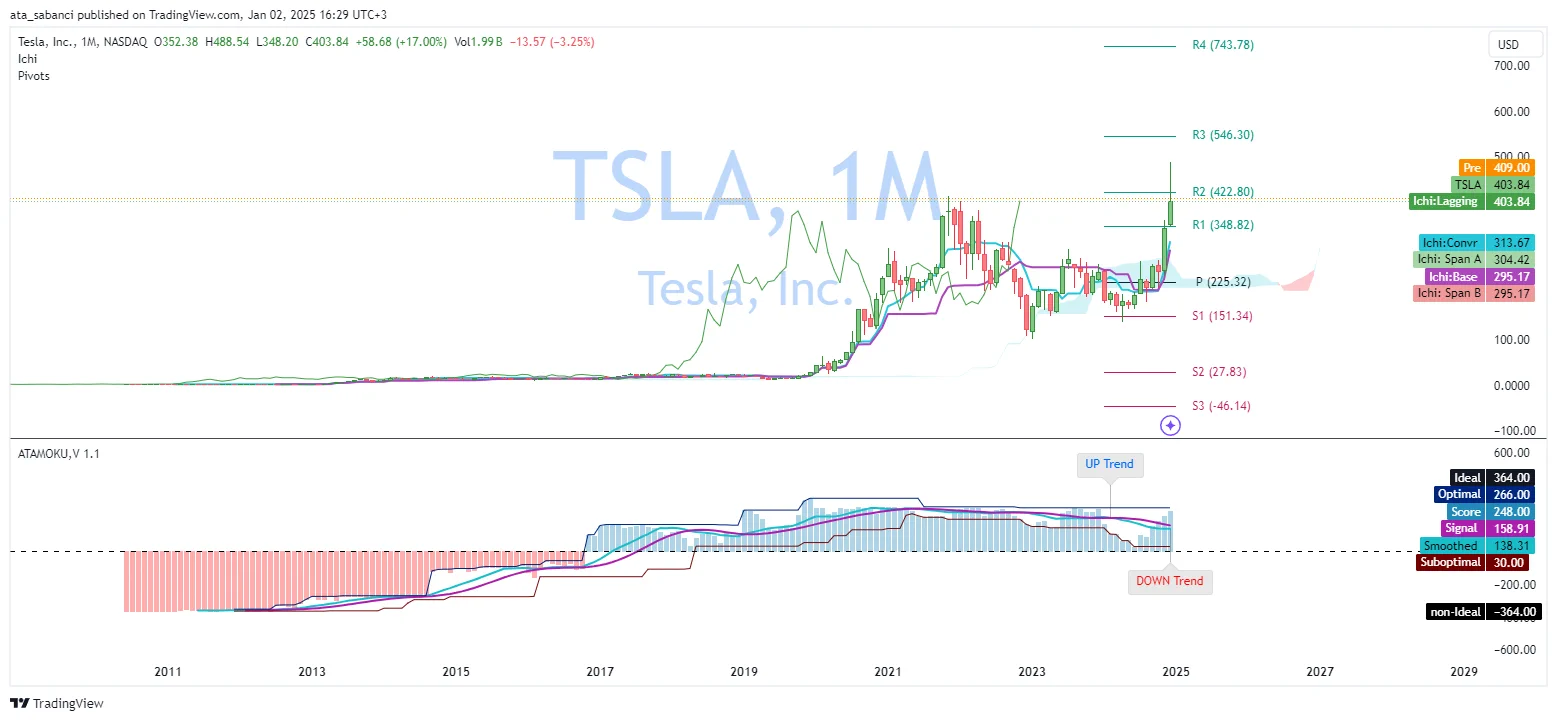
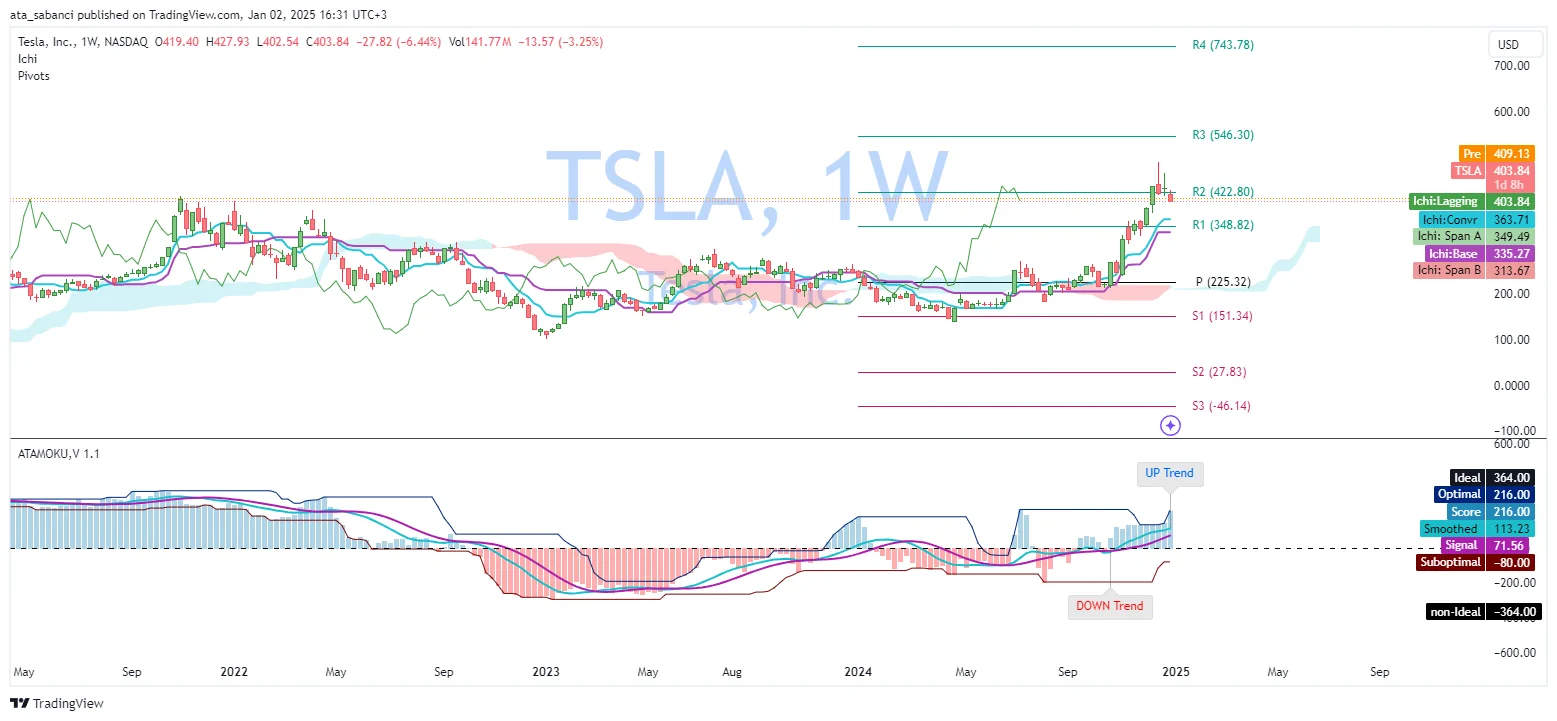
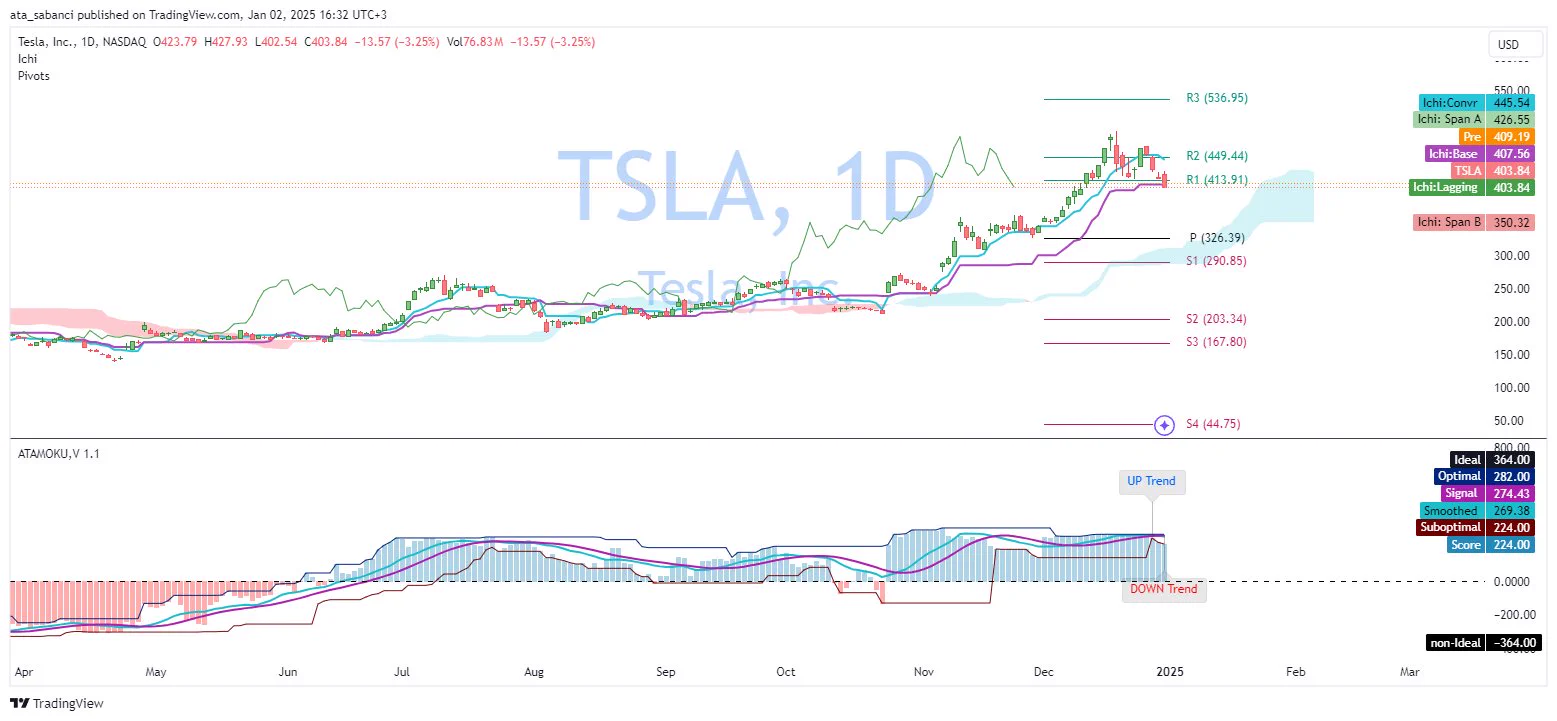
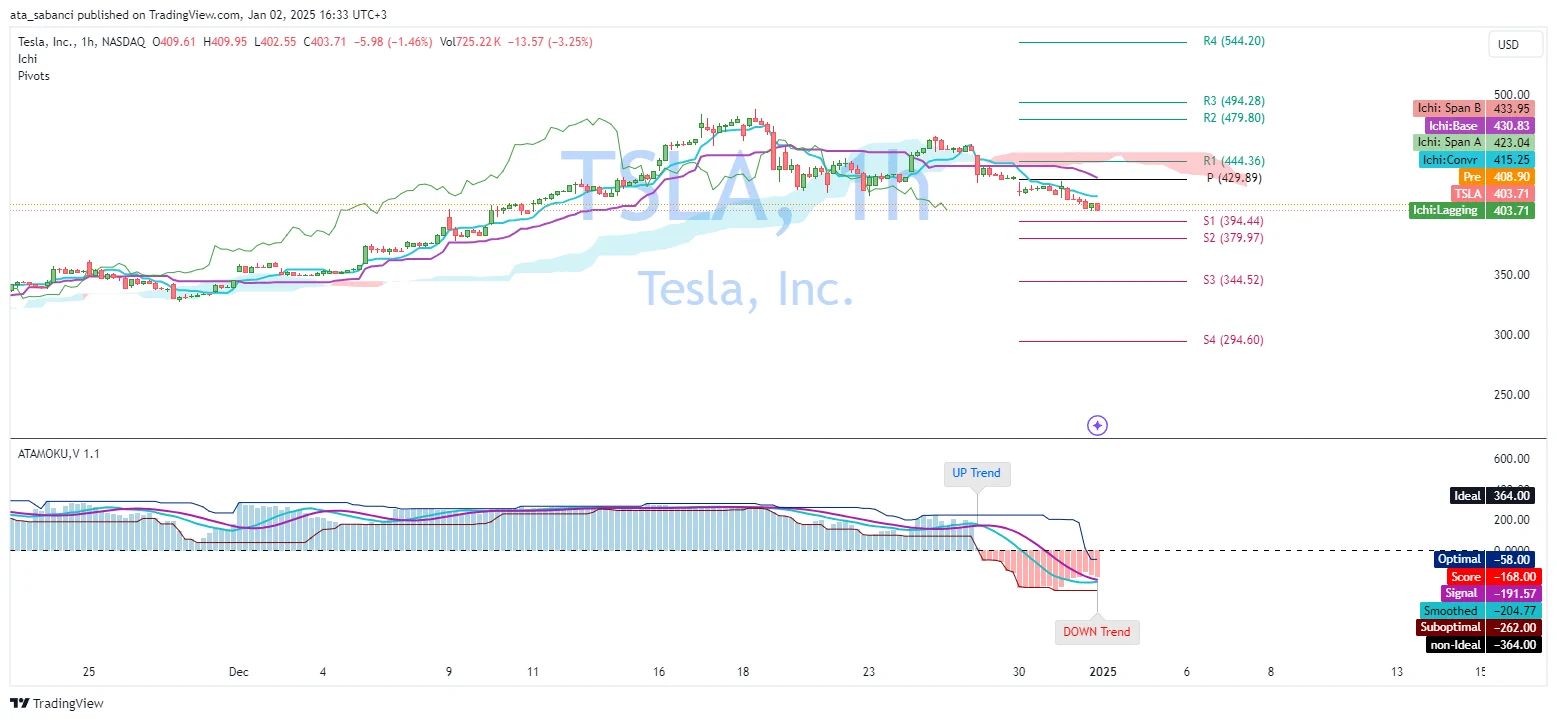
🚨 TSLA Short Position Entry with Ichimoku & ATAMOKU - January 2,2025 (No.1) 🔎 Today, I analyzed Tesla, Inc. (TSLA) using monthly, weekly, daily, and 1-hour charts with the Ichimoku Cloud and ATAMOKU indicator. Based on this analysis, I am entering a short position to test the effectiveness of these indicators in decision-making. Analysis Overview: 🟢 Monthly Chart: TSLA is trading above the Ichimoku Cloud, confirming a long-term bullish trend. The ATAMOKU score is positive (248), and resistance lies at R2 ($422.80). 🟡 Weekly Chart: The broader trend remains bullish, but TSLA shows signs of consolidation below R2 ($422.80). Key support is at the Base Line (Kijun-sen, $335.27). 🔴 Daily Chart: The price is nearing the Conversion Line ($445.54) but remains supported by the Ichimoku Cloud, suggesting caution in the medium term. ⚠️ 1-Hour Chart: Short-term bearish momentum dominates, with TSLA trading below the cloud. R1 ($444.36) acts as a key resistance level, while support lies at S1 ($394.44). Trade Execution: 📌 Action: Opened a short position of 5 shares at $444.36, targeting the short-term resistance on the 1-hour chart. This position aligns with the short-term bearish trend while respecting the broader market context. ------------------------------------------------------------- 💡 Disclaimer: This is an educational post. I’m using paper trading to demonstrate how traders apply indicators like Ichimoku and ATAMOKU in their decision-making process. For a deeper understanding of my journey, approach, and methodology, check out my earlier post as following: Always conduct your own research and analysis before trading. 📚 #StockMarket# #TSLA# #TeslaStock# #StockAnalysis# #IchimokuCloud# #ATAMOKU# #ShortPosition# #TechnicalAnalysis# #PriceAction# #TradingStrategy# #ChartAnalysis# #VolumeAndPrice# #StockTrader# #MarketTrends# #RiskManagement# #BearishMomentum# #TradingEducation# #NASDAQ# #InvestmentStrategy# #TrendAnalysis# #TransparencyInTrading# #PivotPoints# #FinancialMarkets# #DynamicSupport# #ResistanceLevel# #MarketBehavior# #LiveTrading# #StockCharts# #TechnicalIndicators# #TradingViewIdeas# #StockMarketEducation#
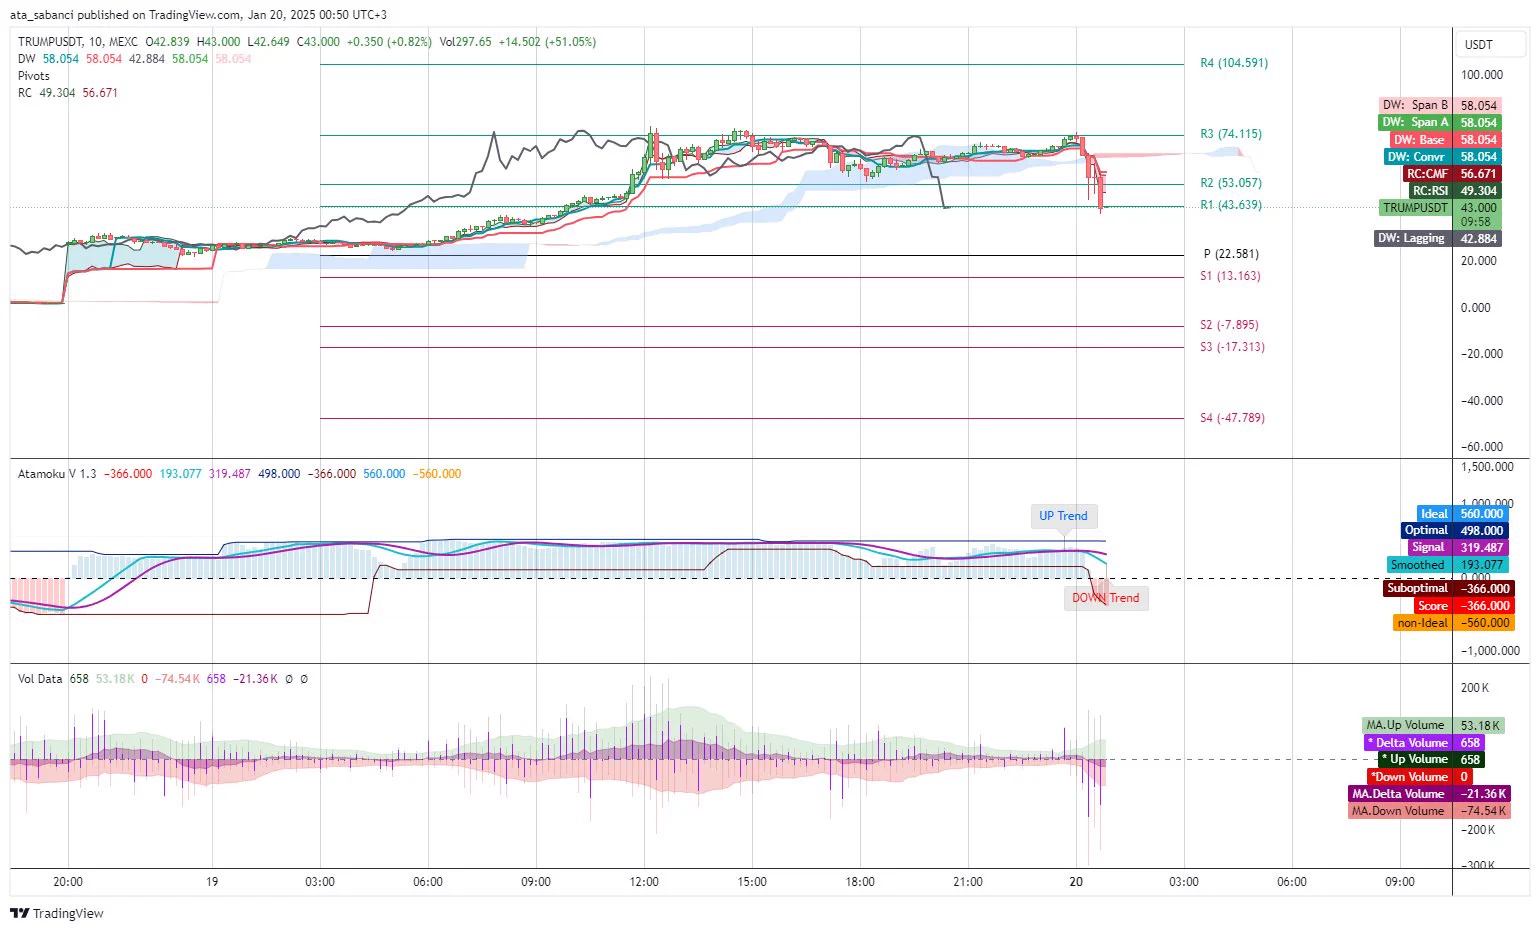
🔍 TRUMPUSDT (10m) Update | Jan 20, 2025 - 00:50 UTC+3 🔍 📉 Price: 43.000 (+0.82%) 🔹 Resistance: 43.639 (Testing R1) 🔹 Support: 37.000 (Next key level to watch) 📈 Indicators: Atamoku Score: -366.000 (Negative), label confirms Down Trend ⚠️ Delta Volume: -21.36K (Sellers still in control, downward pressure remains) Analysis: As previously analyzed, the downward trend persisted, with price testing lower support levels. The negative Atamoku score and volume shift confirm the continuation of the bearish movement. Potential recovery only if price holds above R1 at 43.639. 🔗 Follow our indicators: ⚠️ This analysis is for educational purposes only and is not financial advice. #TRUMPUSDT# #Crypto# #Trading# #Investing# #Finance# #TechnicalAnalysis# #Bears# #MarketUpdate#